

LET’S USE OUR INNOVATIVE TOOLS FOR MONITORING OF WATER COURSES
Flooding is a natural phenomenon, widespread and common throughout the world, which can have a far-reaching effect on people and the environment. It is a rapid and excessive accumulation of water in a normally dry region caused by important and persistent atmospheric precipitations. The phenomenon is accentuated by some local characteristics such as the conditions and composition of the surface of the land, their slope and the topography of the place.
The ProgettoRIO , conceived by Flavio Falcinelli and financed by the companies RadioAstroLab and Fasar Elettronica , monitors waterways (ditches, canals, streams and rivers) reporting potential environmental risks due to floods that cause floods.
An interesting case study concerns the annual experimentation launched in October 2020 on the Misa river, a typical torrential watercourse that flows into the Adriatic Sea through the city of Senigallia (AN), in central Italy. The river, characterized by a very variable regime with frequent flood events, caused floods, some of which were particularly disastrous such as that which occurred in May 2014 and September 2022.
Monitoring involves sample measurements performed by the bridge on the provincial road of Bettolelle, a town about 7 km away in line d air from the center of the city of Senigallia. The site chosen for the surveys is optimal for an immediate and safe positioning of the instrumentation, offering ample visibility of the river basin in a location quite distant from the city of Senigallia in order to report, with sufficient advance, possible flood events with risk of flooding. The instrumentation used is portable, battery powered, each time positioned for the measurement and subsequently removed. The final objective of the experimentation is the installation of an automatic fixed station that continuously records the evolution of river parameters to provide a representation with high temporal resolution, very precise, of the observed scenario. By measuring some parameters of the river area and the local tropospheric perturbations on a daily basis, the data are processed to generate graphs that represent how the percentage of flooding of the basin, the dynamics of the waters, the frequency and the rainfall intensity. This information displays the conditions of the river in real time, signaling potential dangerous situations for the population and the environment.
The aim is to demonstrate to the institutions the effectiveness of a river surveillance system that uses innovative and low-cost instrumentation, designed and built by local companies, to provide a public utility service and civil protection.
The evolution of the project involves the installation of a fixed network of sensors strategically positioned in the territory and the development of an IT system suitable for managing the information coming from the various devices, obtaining the right tool to keep the observed river under control.
All updates on this work are available on our blog ProgettoRio .


THE MICROWAVE TROPOSPHERE
Monitoring of local tropospheric disturbances at the frequency of 11.2 GHz
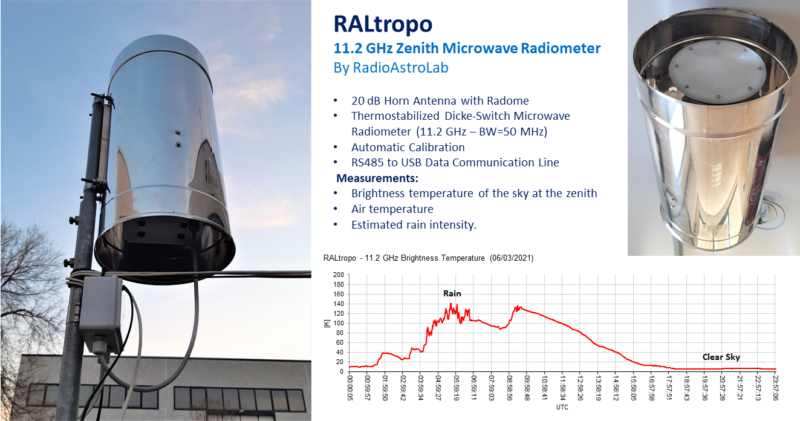
A fundamental condition for a correct analysis of the data collected on the river monitoring point is certainly the study of the intensity of the rainfall affecting the area, as these are the main cause of rise. water level. We are able to obtain this information from a measurement station, located in the southern outskirts of Senigallia (in the urban area), consisting of the RALtropo: a thermo-stabilized switching radiometer, specially developed for these analyzes, which continuously “observes” the sky at the zenith, recording the variations in the brightness temperature attributable to local atmospheric phenomena.
The instrument, which works at the frequency of 11.2 GHz with a passband of 50 MHz, is equipped with a horn antenna (20 dB gain, reception beam width about 14 degrees) oriented towards the zenith, is automatically calibrated, and in addition to the average value of the brightness temperature of the sky (in kelvins), it also measures the temperature of the air at a height of about 9 meters from the ground and its internal temperature. The system works continuously, and thanks to the constantly updated graph on our blog RadioCielo , it is possible to analyze the variations of the parameters during the day. High variations in brightness temperature reveal the presence of water-rich cloud formations moving through the observed volume of atmosphere.
)
It is possible to visualize the conditions of the troposphere in real time thanks to the microwave monitoring available on our blog RadioCielo.